What is it?
- Express code marking system is a ultra-violet footprint identification.
- A vehicle theft deterrent to protect the dealership.
- Optional theft deterrent product available to the client.
How is it applied?
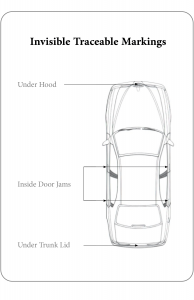
- The unique identification numbers are easily affixed to the metal surfaces (inside the door panels, etc.)
- Window warning label is placed on the driver side window
How it works?
- Window label warnings are placed to deter theft
- Code labels leave an ultra-violet footprint when removed. Both deterrents can easily be detected by law enforcement in the event of theft.
- The permanent vehicle marking system numbers are registered and enable Law Enforcement/Insurance Investigators to identify and recover stolen vehicles.
Benefits
- Theft warranty provides consumers with a $2500 theft benefit if their vehicle is stolen and not recovered within 30 days.
- 3 year guarantee
- One time transfer fee
- Registered owner may qualify for a comprehensive insurance discount
- Aids in vehicle recovery
- Peace of mind
Vehicle Theft Facts
In 2018, 164,781 vehicles were stolen, at an estimated total value of approximately $1.2 billion. This is a 6 percent decrease from the 2017 total for vehicle thefts statewide. The average rate of theft in 2018 was one vehicle every three minutes.
Of the vehicles stolen in 2018, 49.2 percent were automobiles, 39 percent were personal trucks and sport utility vehicles, 2.5 percent were commercial trucks and trailers, and 4.7 percent were motorcycles. All other vehicles (recreational vehicles, construction and farm equipment, special construction, etc.) accounted for 4.6 percent of thefts.
Where The Thefts Occurred
Approximately 51.8 percent of all thefts occurred in Southern California (Los Angeles, Orange, Riverside, San Bernardino, and San Diego counties). Of the thefts in Southern California, 51.6 percent occurred in Los Angeles County.
Approximately 17 percent of all thefts occurred in the San Francisco Bay Area (Alameda, Marin, San Francisco, San Mateo, and Santa Clara counties). Of the thefts in the San Francisco Bay Area, 38.1 percent occurred in Alameda County.
Approximately 13.7 percent of all thefts occurred in the Central Valley (Kern, Fresno, San Joaquin, Stanislaus, Tulare, Merced, Madera, and Kings counties). Of the thefts in the Central Valley, 28.4 percent occurred in Kern County.
The remaining 17.5 percent of thefts occurred throughout the remainder of California.
Information Sources:
CHP 2018 California Vehicle Theft Facts
Vehicle Theft Statistics
Here are the most stolen vehicles in the U.S. according to the NICB, with the most “popular” model year noted along with the total number of units from all model years taken:
- Honda Civic (2000) – 38,426
- Honda Accord (1997) – 36,815
- Ford F-Series Pickup (2006) – 36,355
- Chevrolet Silverado Pickup – 31,566
- Toyota Camry (2017) – 16,906
- Nissan Altima (2017) – 13,284
- Toyota Corolla (2017) – 12,388
- GMC Sierra Pickup (2018) – 11,708
- Dodge/Ram Pickup (2001) – 11,226
- Jeep Cherokee/Grand Cherokee (2000) – 9,818
Here are the vehicles from the 2018 model year that were stolen while they were still new last year and the number of units driven off:
- GMC Sierra Pickup – 1,170
- Ford F-Series Pickup – 1,017
- Toyota Camry – 976
- Nissan Altima – 912
- Chevrolet Silverado Pickup – 790
- Hyundai Elantra – 775
- Ford Transit Van – 723
- Dodge Charger – 719
- Toyota Corolla – 699
- Chevrolet Malibu – 698
Beyond heeding obvious common sense – park in a well lit area, lock your doors, and never leave your keys or the remote key fob in an unattended vehicle – the NICB recommends using a visible or audible warning device to deter thieves. Having a simple hidden “kill switch” installed that disables the ignition system unless its activated generally affords the most bang for the buck in this regard.
Information Sources :
Forbes | Jim Gorzelany | Are You Driving One Of The Most Stolen Cars In The U.S.?
Here’s the NICB’s list of U.S. metropolitan areas having the largest per-capita car theft rates and the number of vehicles reported stolen last year:
- Albuquerque, New Mexico: 7,146.
- Anchorage, Alaska: 3,087.
- Bakersfield, California: 6,748.
- Pueblo, Colorado: 1,175.
- Modesto, California: 3,428.
- Redding, California: 1,037.
Information Sources :
Forbes | Jim Gorzelany | These Are The Cities With The Highest Car Theft Rates